Archive for February, 2012

$1000 month Cash Flow with Investment Property in Calgary!

Saturday, February 25th, 2012

My friend, and FASTEST lender in Canada, Robin Clegg and I recently sat down to talk real estate, investment property, and financing.
Robin is a three time Olympian in Biathlon … which makes him Canada’s fastest mortgage broker. I dare anyone to disprove it. 🙂

We discovered that this up down duplex with a double car garage in 111 Pennsmeadows CL, SE, Penbrooke Property can generate $1000 a month in cash flow!

INVESTMENT PROPERTY SUMMARY

Cash Flow with 5% down payment ($12,950): $853.87/month

Cash Flow with 10% down payment ($25,900): $908.96/month

Cash Flow with 20% down payment ($51,800): $1019.14/month

Investment Details

Hedge against rising interest rates by considering a 10 year term @ 3.89%, 20% down payment, creating a monthly cash flow of $1000.61!

*** Subject to approved income and credit verification, Rates subject to change without notice E & OE

http://tinyurl.com/779w2y8 – For more info

Inner City Calgary Building – Infills

Monday, February 13th, 2012

I’m currently marketing both 50′ lots and new infills in Altadore, SW and Montgomery, NW.  I thought it would be interesting to compare median prices of a few inner city neighbourhoods.

I went back 6 months and looked at homes that were built since 2009 with a maximum lot frontage of 8 meters (25′) that have been sold:

  • In Altadore there have been 13 sales with a median price of $864,492
  • In West Hillhurst there have been 7 sales with a median price of $820,000
  • In Montgomery, there have been 5 sales with a median price of $533,930.

What is the Median SALE price of a 50′ building lot? (Past 6 months)

  • In Altadore, there have been 15 reported MLS sales with a median price of $594,200
  • In West Hillhurst there have been 15 sales with a median price of $567,283
  • In Montgomery there have been 16 sales with a median price of $320,000

Assuming nothing was to change and you were going to buy land at median price, and sell at median price, where would you buy land in order to sell at the highest profit?

2025 35 Ave SW – Wow Marda Loop

Friday, February 10th, 2012

Just Listed this wee bungalow in Marda Loop. $319,900. It’s pretty much Land Value – lots of redevelopment happening on the street and in the hood. Know anyone crazy enough to buy this property? (The buyer: Someone who could imagine living in a 600 sq foot condo … but hates condo’s and condo fees … and sees long term potential of increased land prices in this great neighborhood. Or an investor who is happy with $900-$1200 per month in income.) Currently has a long term tenant who is paying $900 and would love to stay.


See the Exterior Video here!
2025 35 Ave SW, Tiny Bungalow in Marda Loop / Altadore

2nd Video – is the Interior

INTERIOR – 2025 35 Ave SW

And for some Pictures!

Interior Pictures

Calgary home prices up from a year ago – New price tool shows year-over-year growth

Monday, February 6th, 2012

Up until today … I understood that Calgary Real Estate prices increased in 2011 by 1%. With a new Price Index tool … it turns out they increased 2.7%.

I’m starting to understand get why I scored a D – in First Year Stats at Acadia University. It was my worst mark ever … other than 1st year French … which was also a D -.

Stats and French – just don’t make sense to me.
***

Calgary, February 6, 2012 – The year-over-year value of homes in Calgary increased in January 2012 by 2.7 per cent, according to a new price measurement tool vetted by academia and financial industry experts, including the Bank of Canada.

The new MLS® Home Price Index (HPI) was introduced today by the Canadian Real Estate Association in partnership with Canada’s five largest real estate boards – Vancouver, Fraser Valley, Calgary, Toronto and Montreal.

The new tool measures how typical properties are valued in the market rather than relying on average and median prices. In January, for example, the average price declined year-over-year, but only because more homes were sold in the lower-price ranges compared to the previous year, when more luxury home sales occurred.

“By combining information from the MLS® HPI with their own knowledge, experience and skills, REALTORS® can help their clients approach one of life’s most important decisions – that of buying or selling a home – with greater confidence,” says Bob Jablonski, president of CREB®.

The MLS® HPI is calculated using a sophisticated statistical model that estimates
home prices based on their quantitative and qualitative features that are typical to that neighbourhood, such as square footage, number of rooms above the basement level, number of bathrooms and half-bathrooms, whether the property has a fireplace and/or finished basement, lot size or the age of the property, to name a few.

“The MLS® HPI is the best tool to determine true price trends in the market,” says Ann-Marie Lurie, CREB® chief economist. “The commonly used average and median prices can be misleading as they are easily affected by the composition of what is sold.”

For buyers and sellers, the MLS® HPI determines what a typical home is valued at in their neighborhood, as well as how this compares to other neighborhoods. In addition, it provides a true price trend for their community.

“We are excited to be able to offer the purest, most accurate housing data that is currently available,” Jablonski says. “The MLS® HPI can be used to not only determine pricing trends, but also to gain insight into the typical home in a specific market segment, adding value to the existing tools REALTORS® can use to value homes for both buyers and sellers.”

Sneak Peek – Altadore

Monday, February 6th, 2012

Sneak Peek – Altadore. 1628 49 Ave SW. R1 zoned lot coming on the market! ALTADORES ONLY CUL-DE-SAC!!! Should be offered at $670,000. 733 Sq. meters.

Call Altadore’s ReMax Realtor Local Specialist Bryon Howard today to get the jump on this great 1230 sq foot home / building lot.

Also have back pocket listings for two R2 zoned 50′ Altadore Lots.

Hawkwood and Temple – Open House – No Freaking Cookies

Saturday, February 4th, 2012

So excited! I get to do not one but two open houses today! My seller Wendy Rumboldt Renton asked if I was bringing cookies!!! (Do I look like I bake?) Please pop into 148 Hawkfield CR, NW between 1 and 2pm and/or 311 Templeby PL, SE between 3 and 4pm. Awesome family homes. MLS #C3506628 and #C3506608. (There will be no freaking cookie crumbs for me to have to clean up afterwards.) http://tinyurl.com/75bjuv5

Calgary Real Estate Stats – January 2012

Wednesday, February 1st, 2012

The month of January performed as expected.

In 2011 prices increased by 1% … and in 2012 the ‘gods’ are predicted a 2% increase in prices. Not stellar … but with all the projects happening in Alberta … and the constant increases in In-Migration, I think we are shaping up for good increases in prices in 2013.

Between all the stats … if you want to sell in this market – it’s a good time – assuming you price relistically.  If you are a buyer … your are definately in a good place.  This is especially true if you heed the words of Warren Buffet, “Don’t buy for 10 minutes if you don’t plan to own for 10 years.”
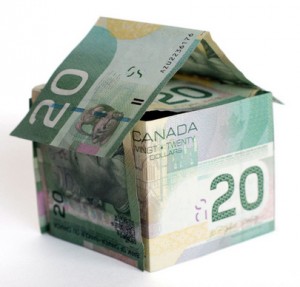
The housing market pointing towards price stability

Calgary, February 1, 2012 – Home sales in the City of Calgary are off to a slow start as buyers show continuing caution, according to figures released today by CREB®.

“Overall, the market is behaving as expected for the winter season,” says Bob Jablonski, president of CREB®.

The year-over-year volume of residential sales in the City of Calgary dropped, but the inventory of available homes declined even faster in January 2012.

The City of Calgary residential market recorded 1,078 sales in January, nearly one per cent below the same month in 2011. This is in part related to the drop in new listings, which declined by 8 per cent over January 2011, causing inventory levels to continue to contract over 2011.
“A lower number of sales is not uncommon for the month of January,” says Jablonski. “The number of sales is offset by the number of listings, ultimately pushing the housing market towards a balanced market territory.”

The single-family market recorded a one-per-cent drop in sales over last year levels, while the condominium market recorded a one-per-cent gain. However, the decline in new listings in the single-family market was much higher than the condominium market, with a year-over-year decline of 11 per cent and 6 per cent, respectively.

“As presented in our housing forecast report, a slow start to the year is anticipated, as consumers continue to be cautiously optimistic regarding purchasing and/or listing their home,” says Jablonski.

The average price of single-family homes in January 2012 was $438,683, a 3-per-cent drop over last year, and over December 2011. Meanwhile, median prices in the single-family market remain relatively stable over last month at $395,000, while posting a 1-per-cent gain over the previous year.

“The price changes are related to the composition of what was sold. The rise in the median price was likely due to the increase in the number of homes sold in the $450,000-$549,999 category, as this category recorded a significant jump in activity in January. The decline in average price is due to the rise in sales in the under-$300,000 category, as well as the decline in the number of homes sold in the upper-price ranges,” Jablonski explains.

The condominium market continues to favor the buyer; however, this market is trending towards balance. The average and median price of condominiums for the month of January 2012 were $268,526 and $245,000, respectively. This corresponds to a 7-per-cent decline in average prices and a 4-per-cent decline in median prices.

“Last January, there was a significant jump in sales in both the $600,000+ price range and the under-$200,000 price range in condominiums. For January 2012, while sales under $200,000 remain strong, there has been an increase in activity in the $200,000-$299,999 price range, mostly at the expense of the condominiums priced above $400,000. This explains the significant decline in condominium prices,” Jablonski concludes.
Bryon Howard, RE/MAX House of Real Estate
20, 2439 54 Ave SW, Calgary, Alberta, T3E 1M4
Tel: 403-287-3880 (Re/Max) or 403-475-7368 (office) Fax: 403-287-3876 or 403-276-8049 (office)
The data included on this website is deemed to be reliable, but is not guaranteed to be accurate by the Calgary Real Estate Board
MLS® MLS REALTOR® Realtor
Trademarks used under license from CREA